
Mapping the Territory
How to step back from development (using Claude and Cursor) to evaluate Firecrawl and o3 ChatGPT as tools for smarter competitor analysis as needed to identify and exploit the business opportunity.

Note: I will at some point split the Plant Dynamics newsletter into multiple columns. I want to separate my AI-led app-building project from my other interests including using economics to explain the world and outlining other investment and business ideas that I do not have time to pursue. Today is the third instalment of the app building project. The previous versions are here and here.
It has never not been important to know as much as you can about the competition. Though no doubt you can become consumed by the mirage/allure of market intelligence and competitive analysis to such a degree that you lose sight of the basic relationship between your product and your customer.
Nevertheless, when playing around with product ideas creating examples and composites based on market and competitor research is necessary to both map strange or “out there” ideas versus what is achievable in practice. The CTO on any project has the job of knowing both what is necessary and what would define a novel competitive differentiator.
I like the Peter Thiel framework of engineering a business that is effectively a niche monopolist. He says “competitive is for losers”. Kevin Kelly is talking about the same idea when he says “don’t be the best, be the only”.
It’s not a question of whether to do the research. Thinking that studying the market can constrain your inner artist is irresponsible excuse-making leaving you destined to fail. Rather, it’s a question of how to do it well, when to do it (periodically but persistently), and putting into practice the latest and greatest tools.
From the previous posts on this topic, I have a rudimentary sketch of the idea. I wanted to use ChatGPT and Firecrawl to simultaneously (a) test these new research tools – Firecrawl in particular, (b) get a sense of the competition in terms of product features and commercial strategy, and (c) based on (b) refine/strengthen the idea as I progress towards building the MVP version of the web-app.
We can think about product research workflow as follows: use ChatGPT to identify relevant competitors, use Firecrawl to extract useful ideas from their websites, then create a profile of each competitor/reference that answers key questions about their commercial and product strategies.
You might say why do all this work when you can just use an agent like Neo or Manus. I could but I wouldn’t learn. The objective here isn’t just to have the job finished, it is to become an expert in the industry so that we can build the best product to address an overlooked need.
Following the early sketch and workflow testing work we did in the previous posts about using Cursor, we can start this session with an explanation of the product concept that we are going to share with o3 ChatGPT.
Here is the description of the concept as inspired by various governments thinking that house prices can be solved with supply-side trickle-down trickery:
A real estate intelligence and matchmaking platform that identifies “under utilized” or “under zoned” (relative to its ultimate use) commercial properties with strong housing redevelopment potential. The housing outcome could be credibly claimed as “affordable”. Think students, seniors and low-income. The US-equivalent would be the so-called “Section 8” housing. The platform combines property data with effectively crowd-sourced expert assessments (planning consultants, contractors, property managers) and connects developers/investors with actionable redevelopment opportunities. Imagine a property profile that expert consultants could contribute to. And then there would be gamification and marketplace aspects to incentivize those with intel to contribute in a structured way.
We would start with “affordable housing” as that is the real estate concept that is most popular with governments, but the platform concept could be extended eventually any type of development including renewable energy, agriculture, warehousing, manufacturing, and so on.
Competitor Terrain
From an initial set of about 25 real estate and geospatial planning platforms – relevant to the concept as outlined above – I ran a first-pass scan using o3 to see which ones had any commercial or product relevance to the opportunity for an affordable-housing, “under utilized site” intelligence platform.
We shortlisted the ten most instructive companies by asking three practical questions:
Do they solve a core piece of the puzzle we care about: zoning and planning insight, land history and owner details, and development marketplace?
Do they have enough market traction to show that buyers will pay for that capability?
Do they leave a visible gap we can identify and potentially exploit?
Here is what we came up with:
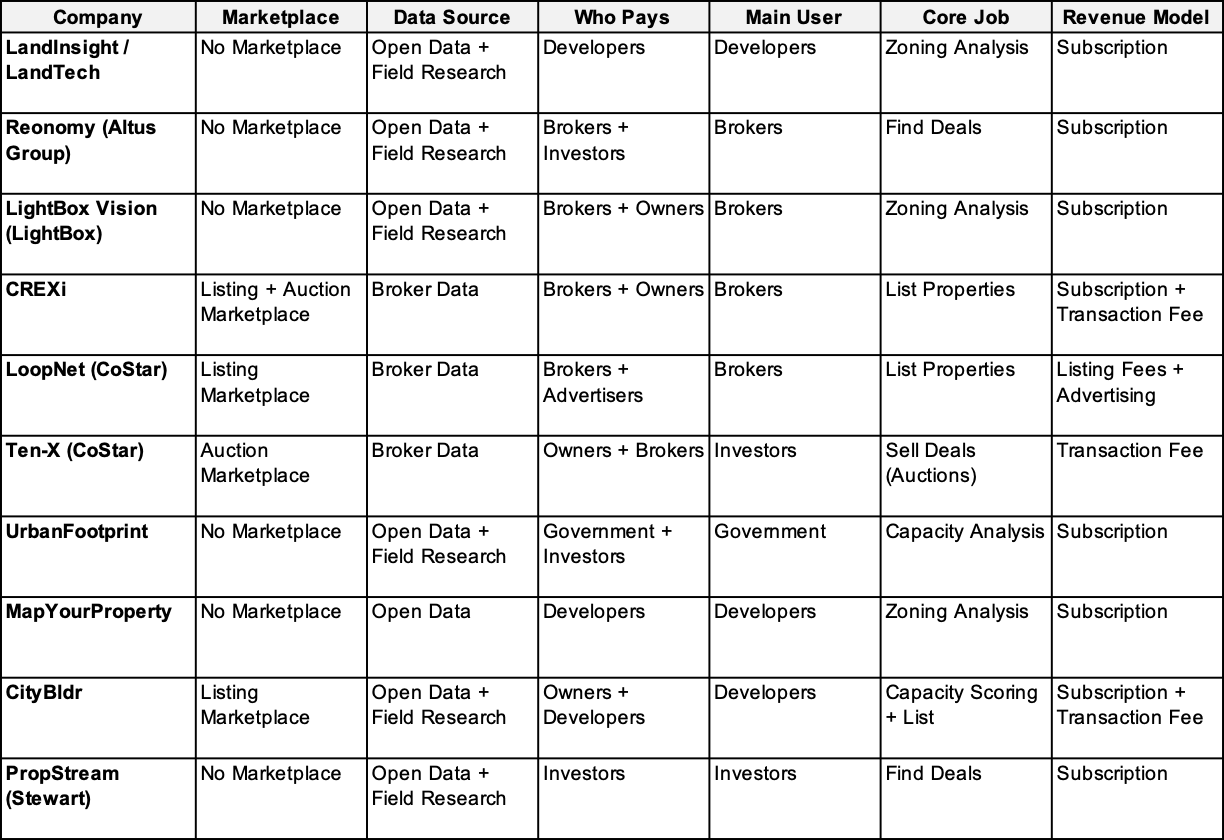
There are too many dimensions and frankly too many interesting companies so we have a kind of cartoonish or non-descriptive table here. For example, what do we mean by Zoning Analysis or Capacity Analysis. This table isn’t yet very helpful.
Here is a partial guide to the table but what follows subsequently - the brief profile of each platform/company - is more interesting and that is what we will come to next: using Firecrawl and other tools to investigate each such company at a deep level.
Anyway, here is the guide to the above table:
Marketplace Type
What the platform’s transaction engine looks like — if there is one.
Listing Marketplace – an online board where brokers or owners post properties; buyers browse and inquire (e.g., LoopNet).
Auction Marketplace – timed bidding environment; highest bid wins and the platform earns a success fee (e.g., Ten-X).
Member Marketplace – access is gated by paid membership or vetting; listings or “wants” are shared within the club (e.g., Brevitas).
No Marketplace – the product sells data or analytics only; it does not host live deal listings (e.g., LandInsight).
Data Source
How the company acquires the raw information that powers its product.
Broker Data – listings or property details uploaded directly by brokers or owners.
Open Data – public records, government open-data portals, zoning bylaws, census tables, etc.
Web Crawl – automated scraping of websites, PDFs, and filing systems.
Field Research – proprietary surveys, phone calls, boots-on-the-ground verification.
When two sources are material, we join them with “+” (e.g., Open Data + Field Research).
Who Pays
The parties that hand money to the platform.
Brokers – commercial real-estate brokers and listing agents.
Owners – property owners or developers paying for exposure or analytics.
Developers – builders or land developers purchasing site-selection tools.
Government – municipalities or public agencies buying licences or data feeds.
Investors – equity investors, lenders or institutional buyers paying for deal signals.
Advertisers – third parties buying ad slots beside listings.
Main User
The primary person or organisation that logs in and “does the work.” Often—but not always—the same as “Who Pays.”
Broker
Developer
Government (e.g., planners, municipal analysts)
Investor
Core Job
The single most important task the user “hires” the product to do.
List Properties – publish and market an asset.
Find Deals – discover under-market or off-market opportunities.
Zoning Analysis – surface land-use constraints and permitted density.
Capacity Analysis – calculate build-out potential or “highest & best use.”
Sell Deals (Auctions) – move an asset to closing via competitive bidding.
Revenue Model
How the platform converts usage into cash.
Subscription – recurring licence fee (monthly or annual).
Transaction Fee – percentage or flat fee when a deal closes.
Advertising – charging for banner ads, featured listings, or promoted search slots.
Listing Fees – pay-to-post charges levied on each property upload.
Consulting / Data Sales – one-off reports, bulk data exports, or professional-services projects.
Subscription + Transaction Fee – hybrid of recurring licence and success-based fee.
Lessons So Far
Our initial scan of about 25 property tech platforms - compressed down to 10 - reveals a conspicuous white space: no single product marries parcel-level zoning intelligence, verified owner contacts, and a transaction engine that can move under-utilised land into affordable-housing deals that would qualify for government funding.
The data-first tools (LandInsight, LightBox Vision, MapYourProperty, UrbanFootprint) stop at analytics. They do not surface live inventory or capital.
The marketplaces (LoopNet, CREXi, Ten-X, CityBldr) excel at transactions but offer — at best — shallow land-use fields and no grant-eligibility insight. Reonomy owns ownership graphs yet lacks density or policy context.
What none of them provide is a “development-ready dossier” that pre-computes (1) by-right and incentive-driven capacity, (2) subsidy or inclusionary-zoning eligibility, (3) verified ownership and outreach channels, and then pushes those parcels straight into a curated listing or auction workflow. That integration is the opportunity.
To exploit it, based on this initial review, we would build a three-layer or three-aspect platform:
Data Spine. Start with open zoning and incentive layers (MapYourProperty playbook), licence parcel/owner graphs from Reonomy or LightBox or public sources, and run CityBldr - style capacity scoring - extended to flag affordability grants, tax-credit zones, and municipal fast-track programs.
Expert Overlay. Invite planners, cost consultants, and community-housing NGOs to annotate parcel dossiers; reward contributions with visibility credits or success-fee sharing (the Brevitas “member” mechanic, but mission-oriented).
Liquidity Hub. expose pre-vetted parcels in a dual‐mode marketplace—free listings for visibility plus a pay-to-participate auction tier (CREXi / Ten-X economics).
We could say something like “revenue comes from developer subscriptions to the dossier library, success fees on closed transactions, and optional advertising modules for service providers.” But this is all to-be-determined.
Launching in a data-rich yet under-served region lets us leverage MapYourProperty-style policy depth while facing thin marketplace competition.
Once the pipeline and underwriting engine prove sticky, we can replicate city‐by‐city, swapping in local policy feeds and scaling the expert network. The prize is a defensible, two-sided network where scarce development sites, vetted capacity data, and affordable-housing capital converge first—and perhaps only—on our platform.
The comparison table showed where each contender touches the data-zoning-marketplace puzzle and, more importantly, where none of them fully connect the dots for affordable-housing redevelopment.
To turn those high-level gaps into a concrete build-or-partner roadmap we now need a second-pass, boots-on-the-ground look at each platform’s mechanics: who really pays, how the data is gathered, how “zoning analysis” is calculated, and whether any live transaction flow proves user willingness to act.
Path Forward
Here is the outline of each of the ten platforms/companies that we would review next - using e.g., Firecrawl - to further review the commercial strategy and product ideas.
LandInsight / LandTech
LandTech’s LandInsight web app helps UK developers and small builders scout off-market sites by blending Ordnance Survey parcels with open-government planning layers, sales comparables and ownership records into a single map. Its paid subscription (~£45–£250 per month) lets users run instant “site viability” scores, download one-click reports and share project pipelines across teams, but it stops at analytics: there is no built-in marketplace or owner-contact graph.
What’s intriguing is how clearly the product monetizes a single developer pain-point - speeding the yes/no on a site - without venturing into listings or owner outreach.
Our follow-up will unpack the scoring logic, UI flow from map click through to the report, and exactly what developer profile (project size, financing stage) converts to a paid seat.
Reonomy (Altus Group)
Reonomy stitches 54 million U.S. parcel records to owners, mortgages and contact details, selling that intelligence to brokers, lenders and investors on an annual-licence basis. Since Altus acquired it in 2021 the focus has remained on data depth - no zoning metrics, no listing workflow - which makes it a powerful ownership spine that still needs planning context and transaction rails.
The compelling bit is its ability to surface off-market owner phone numbers at national scale—something zoning-first tools lack.
Our teardown will probe data freshness, API access terms, and how brokers justify renewal (lead-to-deal conversion metrics).
LightBox Vision (LightBox)
LightBox aggregates nationwide parcel, zoning and environmental data, exposing it through the Vision map UI or via enterprise APIs. The company monetizes through corporate data licences and named-user seats; however, Vision largely presents raw layers without automated under-utilization scoring or any deal marketplace, leaving room to overlay smarter capacity analytics and matchmaking.
Its breadth of zoning attributes is impressive, yet the platform stops short of telling users which parcels are under-utilised or subsidy-eligible.
Next we’ll inspect layer update cadence, UI for multi-layer toggling, and whether Vision’s API could feed our own capacity-scoring engine.
CREXi
CREXi combines a free listing board with a timed online-auction engine, allowing brokers to market properties at no cost and upselling to a “PRO” analytics tier plus success fees on closed auctions. Traffic has grown on SEO and broker syndication, but zoning data is shallow and redevelopment filters minimal, signalling an opportunity to bolt richer land-use insight onto a CREXi-style workflow.
The noteworthy twist is the dual funnel — free to list for liquidity, fee-based auction for monetisation — which might suit redevelopment parcels.
We’ll dissect auction conversion rates, pricing levers in the PRO tier, and how zoning data appears (or doesn’t) in the listing workflow.
LoopNet (CoStar)
With roughly 13 million monthly visitors, LoopNet is the web’s biggest commercial-property storefront. Brokers pay tiered listing and advertising packages while search remains free to investors and tenants. CoStar’s depth of comps and tenant data sits behind a paywall, yet LoopNet listings still expose little zoning or build-out information, meaning high traffic but low planning intelligence.
Its sheer traffic shows the power of SEO and broker FOMO, but listings still lack meaningful zoning or build-out cues.
Our analysis will map the listing-creation UI, fee tiers, and any hooks CoStar provides for third-party data overlays.
Ten-X (CoStar)
Ten-X specialises in online CRE auctions that now surface directly inside LoopNet, targeting institutional sellers who pay success-based commissions for a 90-day digital sale process. The platform vets legal and financial documents but does not analyze zoning potential; it dominates distressed, income-producing assets rather than land ripe for redevelopment, hinting at a gap for “under-zoned” parcel auctions.
What stands out is the tight integration of data verification with a success-fee model—yet zoning potential is absent from due-diligence packs.
We’ll examine asset mix, fee schedules, and whether auction templates could accommodate “under-zoned land” as a category.
UrbanFootprint
UrbanFootprint’s decision-intelligence cloud bundles parcel geometry with climate-risk, socio-economic and equity layers, sold mainly to utilities, banks and public agencies on a seat or enterprise licence. Its strength is scenario modelling — policy impacts, resilience scoring — yet it omits ownership contacts and marketplace functions, so turning insights into live deals is left to external partners.
Its scenario engine shows demand for policy-aware analytics, but there is no ownership contact graph or marketplace hand-off.
Next-stage research will review capacity-analysis methodology, export formats, and user adoption triggers inside municipal workflows.
MapYourProperty
Toronto-based MapYourProperty automates due-diligence by stacking 160 provincial, municipal and environmental regulations over Ontario parcels. Developers and planning lawyers pay per seat or per report for instant zoning summaries that satisfy municipal submissions; expansion outside Ontario is limited, and the product lacks owner-matching or listing capability, making it a local but deep policy layer template.
The interesting angle is its hyper-local depth — a provincial template for incentive tagging we could replicate elsewhere.
We will inspect pricing by seat vs. report, report acceptance by lenders and cities, and technical effort to port the model to other jurisdictions.
CityBldr
CityBldr uses machine-learning on public and private data to rank every parcel in select U.S. metros for “highest & best use,” then encourages owners to list assemblages through an in-house marketplace. Revenue mixes low-cost subscriptions for scoring access with success fees on brokered sales. Affordable-housing or incentive filters are nascent, and owner contact coverage varies by city, offering scope to specialise further.
Its merge of capacity scoring with a nascent marketplace hints at the integrated flow we envision, albeit without an affordability lens.
Our teardown will test scoring transparency, owner-listing conversion, and UX steps from parcel score to live listing.
PropStream (Stewart)
PropStream targets single-family and small multifamily investors, packaging nationwide assessor files, MLS feeds and distress indicators (pre-foreclosure, lien, vacancy) into a US$99-per-month lead-gen tool, plus paid skip-tracing and marketing automation. It excels at off-market SFR prospecting but has minimal zoning or redevelopment analytics, suggesting its dataset could seed outreach tooling while leaving capacity scoring to new layers.
Its end-to-end outreach workflow is compelling, even if zoning depth is minimal—offering a model for investor tools around larger redevelopment sites.
We’ll evaluate marketing-automation UI, data accuracy against other sources, and feasibility of scaling beyond SFR into mixed-use infill parcels.
Next Phase of Research
This sets the stage for a review or teardown of each competitor/reference. The above competitive analysis reveals a fascinating ecosystem of real estate platforms, each solving partial problems within the property intelligence space.
What emerges is not just a gap in the market, but a missing integration layer - the computational infrastructure that connects parcel-level zoning intelligence with ownership data and transaction mechanisms optimized for affordable housing development or any other policy/program implemented by government.
This is a classic example of what I often observe in technology markets: the most valuable opportunities exist not in building yet another point solution (creating a new specific tool such as how to transform pixels into CSV data), but in constructing the abstraction layer that unifies siloed systems into a coherent workflow. AI could make no more progress and we could create no new technology otherwise and still we would have 30-50 years of work just organizing data we already have for problems that we already have.
The power law distribution of value creation suggests that building this connective tissue - a platform that transforms "could be developed" into "is being developed" - would yield disproportionate returns both financially and socially.
Like the best deep learning architectures, the optimal solution here isn't about adding more parameters to existing models, but designing a new architecture that fundamentally reframes the problem. The so-called opportunity “white space” identified represents not just a business opportunity, but a computational lens through which to reimagine how we allocate our most constrained resource: urban land. Especially urban land with water supply. Stay tuned.